When programming you need to know what is happening inside that function or method. You need to reproduce a bug or you are debugging a performance issue. Most of the time adding a trace statement is enough.
When debugging production, you’re not going to find the answer with a trace message on a remove server. At some point your app gets complicated enough that you need to see what’s actually happening — not guess. That’s where observability comes in.
Observability means your system tells you what it’s doing: how long each operation takes, how often things fail, and what happened right before something went wrong. And it turns out the same signals that help you debug production are the ones that let you wire up AI-driven automation later — but that’s a story for another post. Today, let’s get the stack running locally.
What we’re building
We’ll be working with a Rails 8 chatbot app backed by a local LLM. The user sends
a message, Rails enqueues a LlmResponseJob via SolidQueue, and the job calls
an OpenAI-compatible API (Ollama, LM Studio, or any provider). This gives us
something worth observing: HTTP requests, background jobs, and external API calls
all in one flow.
By the end of this post, you’ll have:
- Distributed traces in Jaeger showing the full request → job → LLM span chain
- Prometheus metrics scraped from the Rails app
- Logs collected by Fluent Bit and queryable in Loki
- All of it visible in a single Grafana dashboard
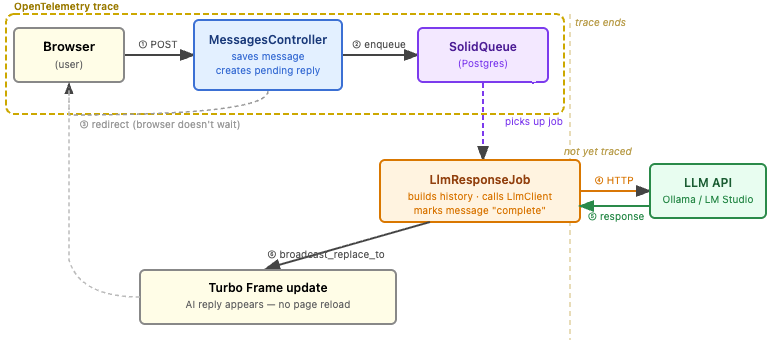 The async request flow. The OTEL trace covers the HTTP request through the SolidQueue enqueue. The job execution and LLM call run outside the current trace boundary.
The companion code is at BrianMehrman/rails-llm-demo.
The stack
Five tools, each with one job:
- Jaeger answers “where did the time go?” — it stores distributed traces so you can see exactly which database query or LLM call ate your latency.
- Prometheus answers “how often and how fast?” — it scrapes numeric metrics (request rates, durations, error counts) on a schedule.
- Loki answers “what happened?” — it aggregates structured log lines so you can filter and search across your app’s output.
- Grafana is the single pane of glass. It connects to all three and lets you build dashboards that show traces, metrics, and logs side by side.
- Fluent Bit is the log collector. It runs as a DaemonSet, reads container logs directly from the node, and ships them to Loki — your app never touches a logging SDK.
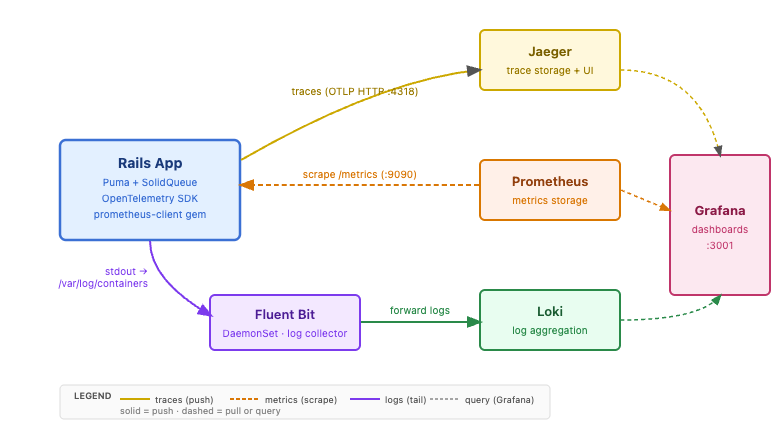 The five observability services and how they connect to the Rails app. Traces push to Jaeger; Prometheus scrapes metrics; logs flow via Fluent Bit to Loki. Grafana queries all three.
Spinning up the stack
All five services — Jaeger, Prometheus, Loki, Grafana, and Fluent Bit — are deployed as Helm charts into local Kubernetes via Skaffold. Start them with:
skaffold run -f skaffold.deps.yaml
If you use bin/dev to run the app (recommended), this happens automatically:
bin/dev calls bin/deps start, which runs Skaffold if the deps aren’t
already up.
Here are the relevant releases from skaffold.deps.yaml:
deploy:
  helm:
    releases:
      - name: kube-prometheus-stack
        remoteChart: kube-prometheus-stack
        repo: https://prometheus-community.github.io/helm-charts
        version: "65.1.1"
        valuesFiles:
          - charts/kube-prometheus-stack/values.yaml
        setValues:
          grafana.service.type: LoadBalancer
          grafana.service.port: 3001
          prometheus.service.type: LoadBalancer
          prometheus.service.port: 9090
      - name: loki
        remoteChart: loki
        repo: https://grafana.github.io/helm-charts
        version: "6.18.0"
        valuesFiles:
          - charts/loki/values.yaml
      - name: jaeger
        remoteChart: jaeger
        repo: https://jaegertracing.github.io/helm-charts
        version: "3.3.1"
        valuesFiles:
          - charts/jaeger/values.yaml
      - name: fluent-bit
        remoteChart: fluent-bit
        repo: https://fluent.github.io/helm-charts
        version: "0.47.9"
        valuesFiles:
          - charts/fluent-bit/values.yaml
Prometheus scrapes the Rails app via a ServiceMonitor configured in
charts/kube-prometheus-stack/values.yaml — no separate prometheus.yml
to manage. Grafana, Prometheus, and Loki are exposed as LoadBalancer services
so Docker Desktop binds them directly to localhost.
Open Grafana at http://localhost:3001 and log in with admin / admin.
Jaeger and Loki are already wired up as datasources — no manual configuration
needed.
Instrumenting the Rails app
Add the OTEL gems to your Gemfile:
gem "opentelemetry-sdk"
gem "opentelemetry-exporter-otlp"
gem "opentelemetry-instrumentation-rails"
gem "opentelemetry-instrumentation-active_record"
gem "opentelemetry-instrumentation-http"
gem "prometheus-client"
Create config/initializers/opentelemetry.rb:
if ENV["OTEL_ENABLED"] == "true"
  require "opentelemetry/sdk"
  require "opentelemetry/exporter/otlp"
  require "opentelemetry/instrumentation/rails"
  require "opentelemetry/instrumentation/active_record"
  require "opentelemetry/instrumentation/http"

  OpenTelemetry::SDK.configure do |c|
    c.service_name    = ENV.fetch("OTEL_SERVICE_NAME", "rails-llm-demo")
    c.service_version = ENV.fetch("OTEL_SERVICE_VERSION", "1.0.0")
    c.use "OpenTelemetry::Instrumentation::Rails"
    c.use "OpenTelemetry::Instrumentation::ActiveRecord"
    c.use "OpenTelemetry::Instrumentation::Http"
  end
end
The OTEL_ENABLED guard means the app runs normally in tests and CI without
touching the observability stack. The OTLP exporter picks up
OTEL_EXPORTER_OTLP_ENDPOINT from the environment (default: http://localhost:4318).
For the LLM client, wrap the HTTP call in a manual span so the trace shows the LLM as a child of the background job:
tracer = OpenTelemetry.tracer_provider.tracer("llm_client")

tracer.in_span("llm.chat", attributes: { "llm.model" => @model }) do |span|
  response = make_request(messages)
  span.set_attribute("llm.response_length", response.to_s.length)
  response
end
Enable tracing by setting OTEL_ENABLED=true in your .env file, then start
the app normally:
bin/dev
bin/deps start (called by bin/dev) detects OTEL_ENABLED=true and
automatically kubectl port-forwards the Jaeger collector to localhost:4318,
so traces flow without any manual plumbing.
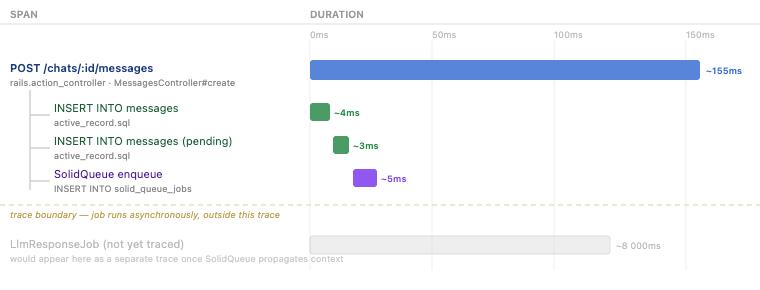 A single OTEL trace for one chat message. The three spans inside the boundary show the controller, two DB inserts, and the SolidQueue enqueue. The job and LLM call would appear in a future trace once SolidQueue propagates context.
Send a chat message, then open the Jaeger UI at http://localhost:16686. Select
the rails-llm-demo service and click “Find Traces.” You’ll see the HTTP POST
trace with three child spans: the ActiveRecord insert, the SolidQueue job enqueue,
and — once the job runs — the llm.chat span showing exactly how long the LLM
took to respond.
Patterns worth monitoring
Once you have traces and metrics flowing, here are three things to actually watch and what they tell you.
LLM p95 latency — In Jaeger, filter traces by operation name llm.chat
and look at the latency distribution. The p95 (95th percentile) is the number
to care about: it tells you what a bad-but-not-worst-case user experience looks
like. Local LLMs can vary wildly — a cold Ollama model might take 30 seconds;
a warm one might take 2. Set your baseline before you optimize.
Job queue backlog — In Prometheus, query:
rate(http_server_requests_total{path="/chats/*/messages"}[5m])
Compare the rate of incoming messages against the rate of completed jobs. If
messages are arriving faster than LlmResponseJob is finishing, your queue
is growing. That’s when you add workers.
LlmResponseJob error rate — In Loki, query:
{app="rails-llm-demo"} |= "LlmResponseJob" |= "error"
This surfaces job failures in your log stream. Pair it with the status="error"
label on the llm_request_duration_seconds Prometheus metric for an alert:
when errors exceed 5% of LLM requests, something is wrong with the LLM provider.
Fluent Bit and log collection
The setup above gets traces to Jaeger and metrics to Prometheus. For logs, the cleanest approach is to let the app write to stdout (which Rails does by default) and have a log agent collect and ship them. Fluent Bit is the right tool for this.
Instead of adding a Loki library to your app, Fluent Bit reads directly from the container log files on each node, parses them, and forwards structured records to Loki. Your app doesn’t know Loki exists. That’s the production pattern.
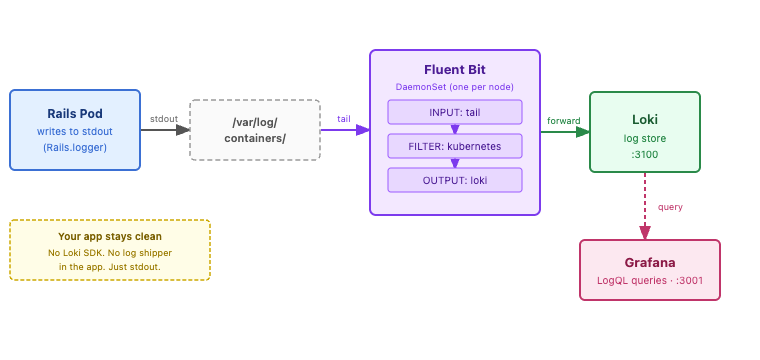 The log pipeline. Rails writes to stdout; the container runtime writes that to /var/log/containers; Fluent Bit tails, filters, and forwards to Loki; Grafana queries with LogQL. The app never knows Loki exists.
Fluent Bit is already included in skaffold.deps.yaml as a DaemonSet, so it
comes up with the rest of the stack. Its configuration lives in
charts/fluent-bit/values.yaml. The key parts:
config:
  inputs: |
    [INPUT]
        Name              tail
        Path              /var/log/containers/*.log
        multiline.parser  docker, cri
        Tag               kube.*
        Refresh_Interval  5

  filters: |
    [FILTER]
        Name                kubernetes
        Match               kube.*
        Merge_Log           On
        Keep_Log            Off

    [FILTER]
        Name    record_modifier
        Match   kube.*
        Record  app rails-llm-demo
        Record  env local

  outputs: |
    [OUTPUT]
        Name        loki
        Match       kube.*
        Host        loki.default.svc.cluster.local
        Port        3100
        Labels      job=fluent-bit,app=rails-llm-demo
        Line_Format json
        auto_kubernetes_labels on
The Kubernetes filter enriches each log record with pod metadata (namespace, container name, labels) before the record reaches Loki. Because it runs as a DaemonSet, it picks up logs from every pod automatically — including the Rails app — with no changes to the application.
In Grafana, go to Explore → Loki and run {app="rails-llm-demo"}. Instead of
raw text, you get structured JSON records with timestamp, container name, and
log level as separate fields — which means you can filter with LogQL:
{app="rails-llm-demo"} | json | level="ERROR"
That’s the difference between searching logs and querying them.
What’s next
You now have a full local observability loop: traces in Jaeger, metrics in Prometheus, logs in Loki, and everything queryable in Grafana. A few directions to take it further:
- Grafana dashboards — pin the three queries above to a dashboard so you see them at a glance instead of running them manually in Explore.
- Alerting — use Grafana’s alert rules to get a notification when LLM error rate crosses a threshold.
- Extend to other services — the same OTEL initializer pattern works for any Ruby process. Add it to your workers, CLIs, or a second service and traces will automatically connect across service boundaries.
The stack you built here is the same one you’d run in production — scaled up, but structurally identical. That’s the point: local observability shouldn’t be a toy. It should be the real thing.